Information Design | FLIP class & Exercise
INFORMATION DESIGN
09/01/2023 - 24/02/2023
Jonathan Wiguna Halim 0356790
Information Design | Exercise
Instructions
FLIP class slides
FLIP 1: Types of Infographic
As a group, we were required to research the different types of infographics, the kind of information they are applicable for, and also provide an example for each. We were able to identify 8 types of infographics and their specific uses and then compiled them into the slides as shown below.
Types of infographic
FLIP 2: Saul Wurman's L.A.T.C.H
In our group, we are to present an explanation of the topic and provide examples or scenarios of what information is best utilized with each principle.
L.A.T.C.H slides presentation
FLIP 3: Miller's Law- Chunking
As a group, we are to present an explanation of the topic and provide an example of how to best utilize this technique in terms of visual delivery for each of these approaches:
1. A well-designed infographic
2. UX/UI, web, app, games (screen-based basically)
Chunking slides presentation
FLIP 4: Manuel Lima's 9 Directives Manifesto
In our group, we have to present an explanation on this topic and find one example of how to best display and utilize design for each of the directives.
In conclusion, also present one good designed infographic that best illustrates the 9 directives for information visualizations and one poorly designed infographic that failed to address the directives.
Manuel Lima 9 directives manifesto slides presentation
Exercise 1
Quantify Objects
Quantity (count) your chosen items and arrange the objects into a presentable layout or chart. Take a picture and submit it!
Deadline: Week 1
Keep it simple, and present the information as clear as possible and as interesting as possible. The aesthetic is key but so does information delivery!

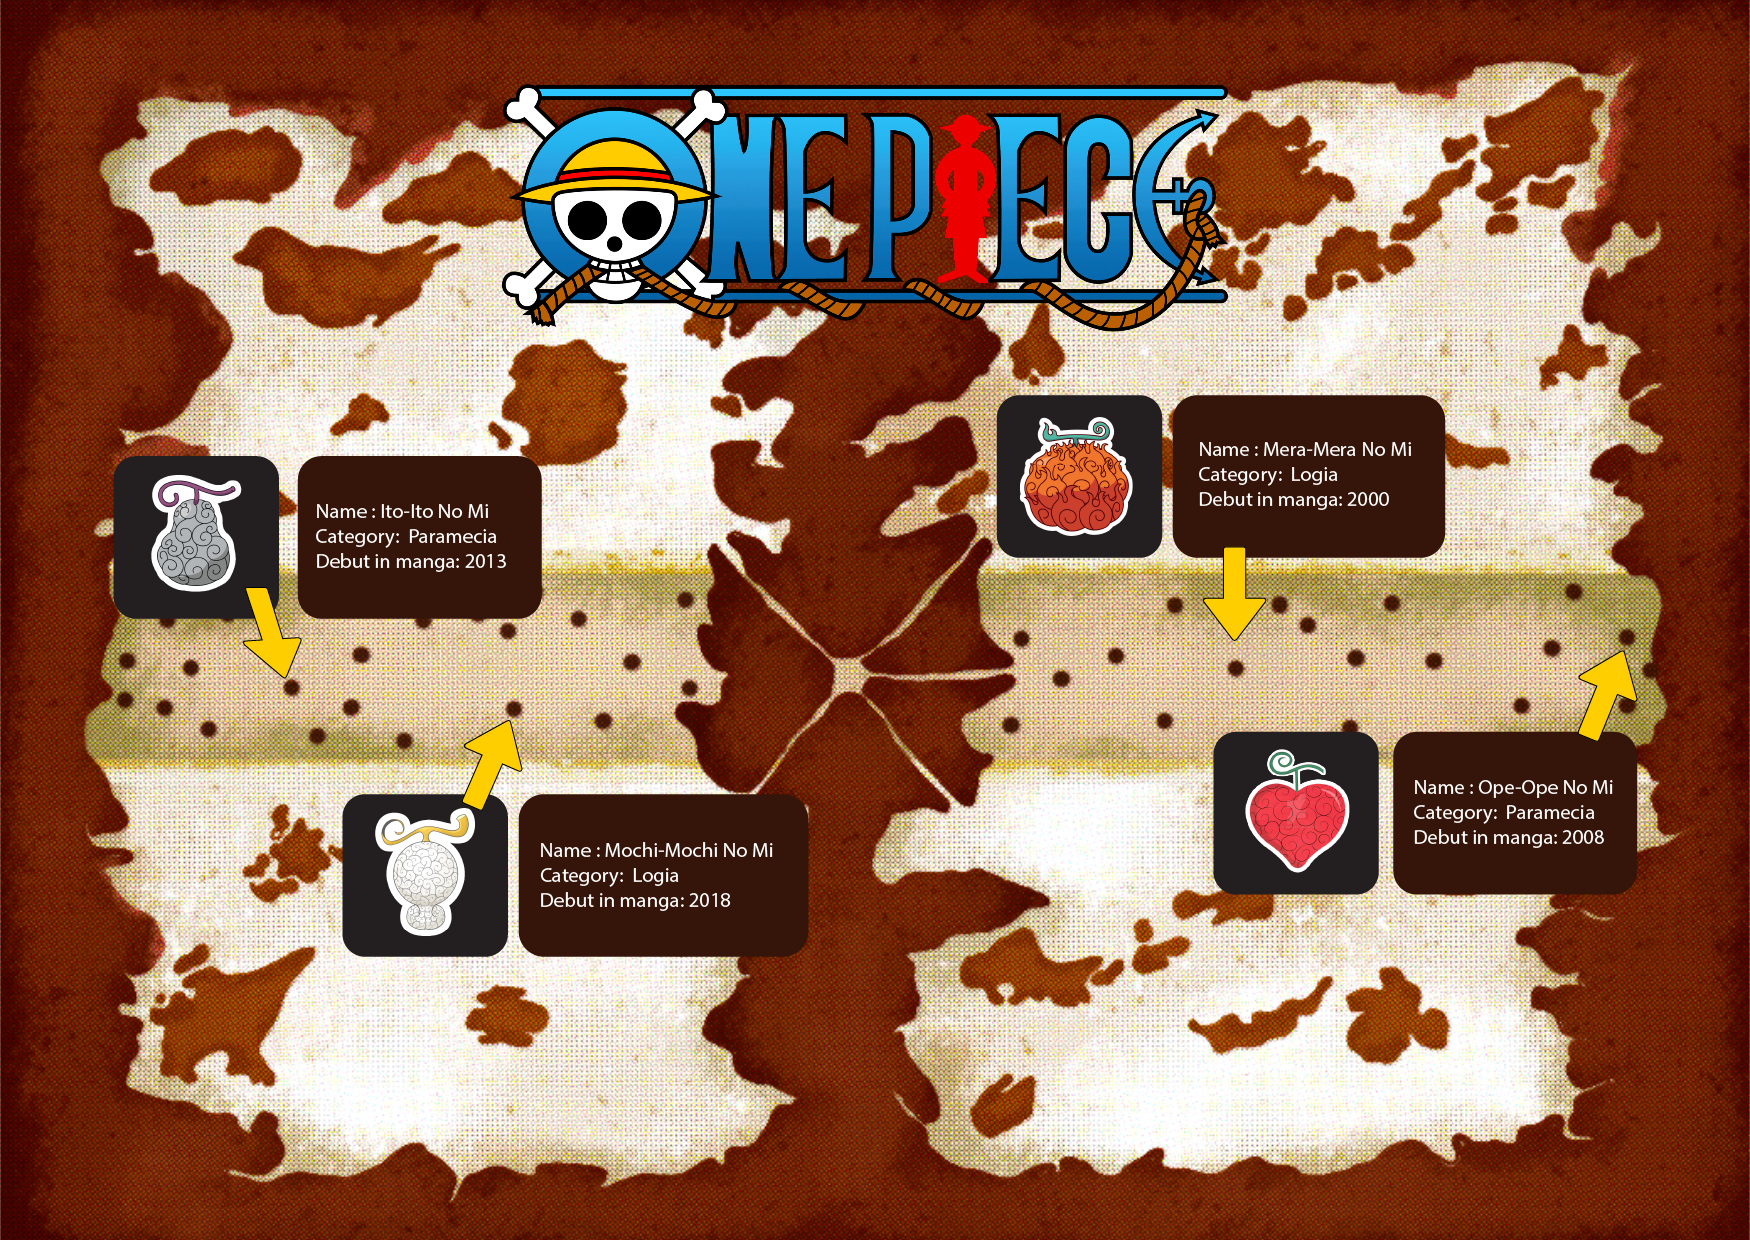
Organize a group of information into a visual poster that combined and utilizes the LATCH principles (min. 4)
Requirements:
Size resolution: 1240 × 1750 pixels or 2048 × 2048 pixels
Use the digital photo editing/illustration software available to assemble the pokemon into a LATCH infographic poster. You can reuse back the images of the monsters, but do create the rest of your own visuals to complete the poster.


Comments
Post a Comment